A subplot function for R
Yuliang Zhang / 2018-05-06
I allways want to find a “Subplot” like function in R, unlike Matlab and Python, R doesn’t have a convenient subplot function. I found a subplot function at the frist place indeed, but it no longer update. Then I found a script provided a pseudo-subplot solution, and the plotly package include a subplot function. But all those solution is not equal to the subplot in Matlab. Today, I really found a great subplot function in R named ggarrange which is a function of package ggpubr(published at 2017-11-14). Here is an example show how it works:
library(ggpubr)
library(ggplot2)
#creat two ggplot graphic object
## scatter plot
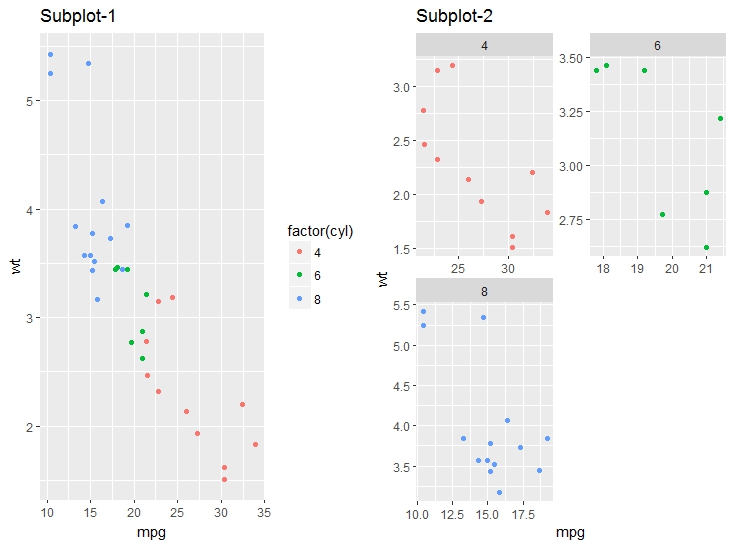
p1 <- ggplot(mtcars, aes(mpg, wt, colour = factor(cyl))) +
geom_point() + ggtitle('Subplot-1')
## scatter plot with facet
p2 <- ggplot(mtcars, aes(mpg, wt, colour = factor(cyl))) +
geom_point() + facet_wrap( ~ cyl, ncol=2, scales = "free") +
guides(colour="none") + ggtitle('Subplot-2')+
theme()
# use ggarrange to arrange
ggarrange(p1,p2)
Result
But i find a small bug in this function, if you have as many as 15 graphic object(the number I test), the “ncol” and “nrow” parameters will make a mistake1.
- I just figure this out, you must give this two parameters at the same time, eg. ‘nrow = 2,ncol = 4’ ↩